I Wrote a Sloth-Like Peak-caller and Fixed it
The Program that Takes Forever
We are making a new peak-caller for eCLIP data. Therefore I am trying several different ways - different distribution, different regions … etc. The purpose of a peak caller is trying to answer: “which genomic/RNA region is bound by the protein, given the sequencing reads enriched by some protein pulldown process”. Turning that into a statistical problem, now it translates to “Given the null distribution (estimated by whatever mysterious assumption you are making), which region has more reads than expected?”
To implement this program, I need to “count how many reads are mapped each region”, so that I can calculate the p-value according to the null distribution.
Click here for eCLIP experiment figure
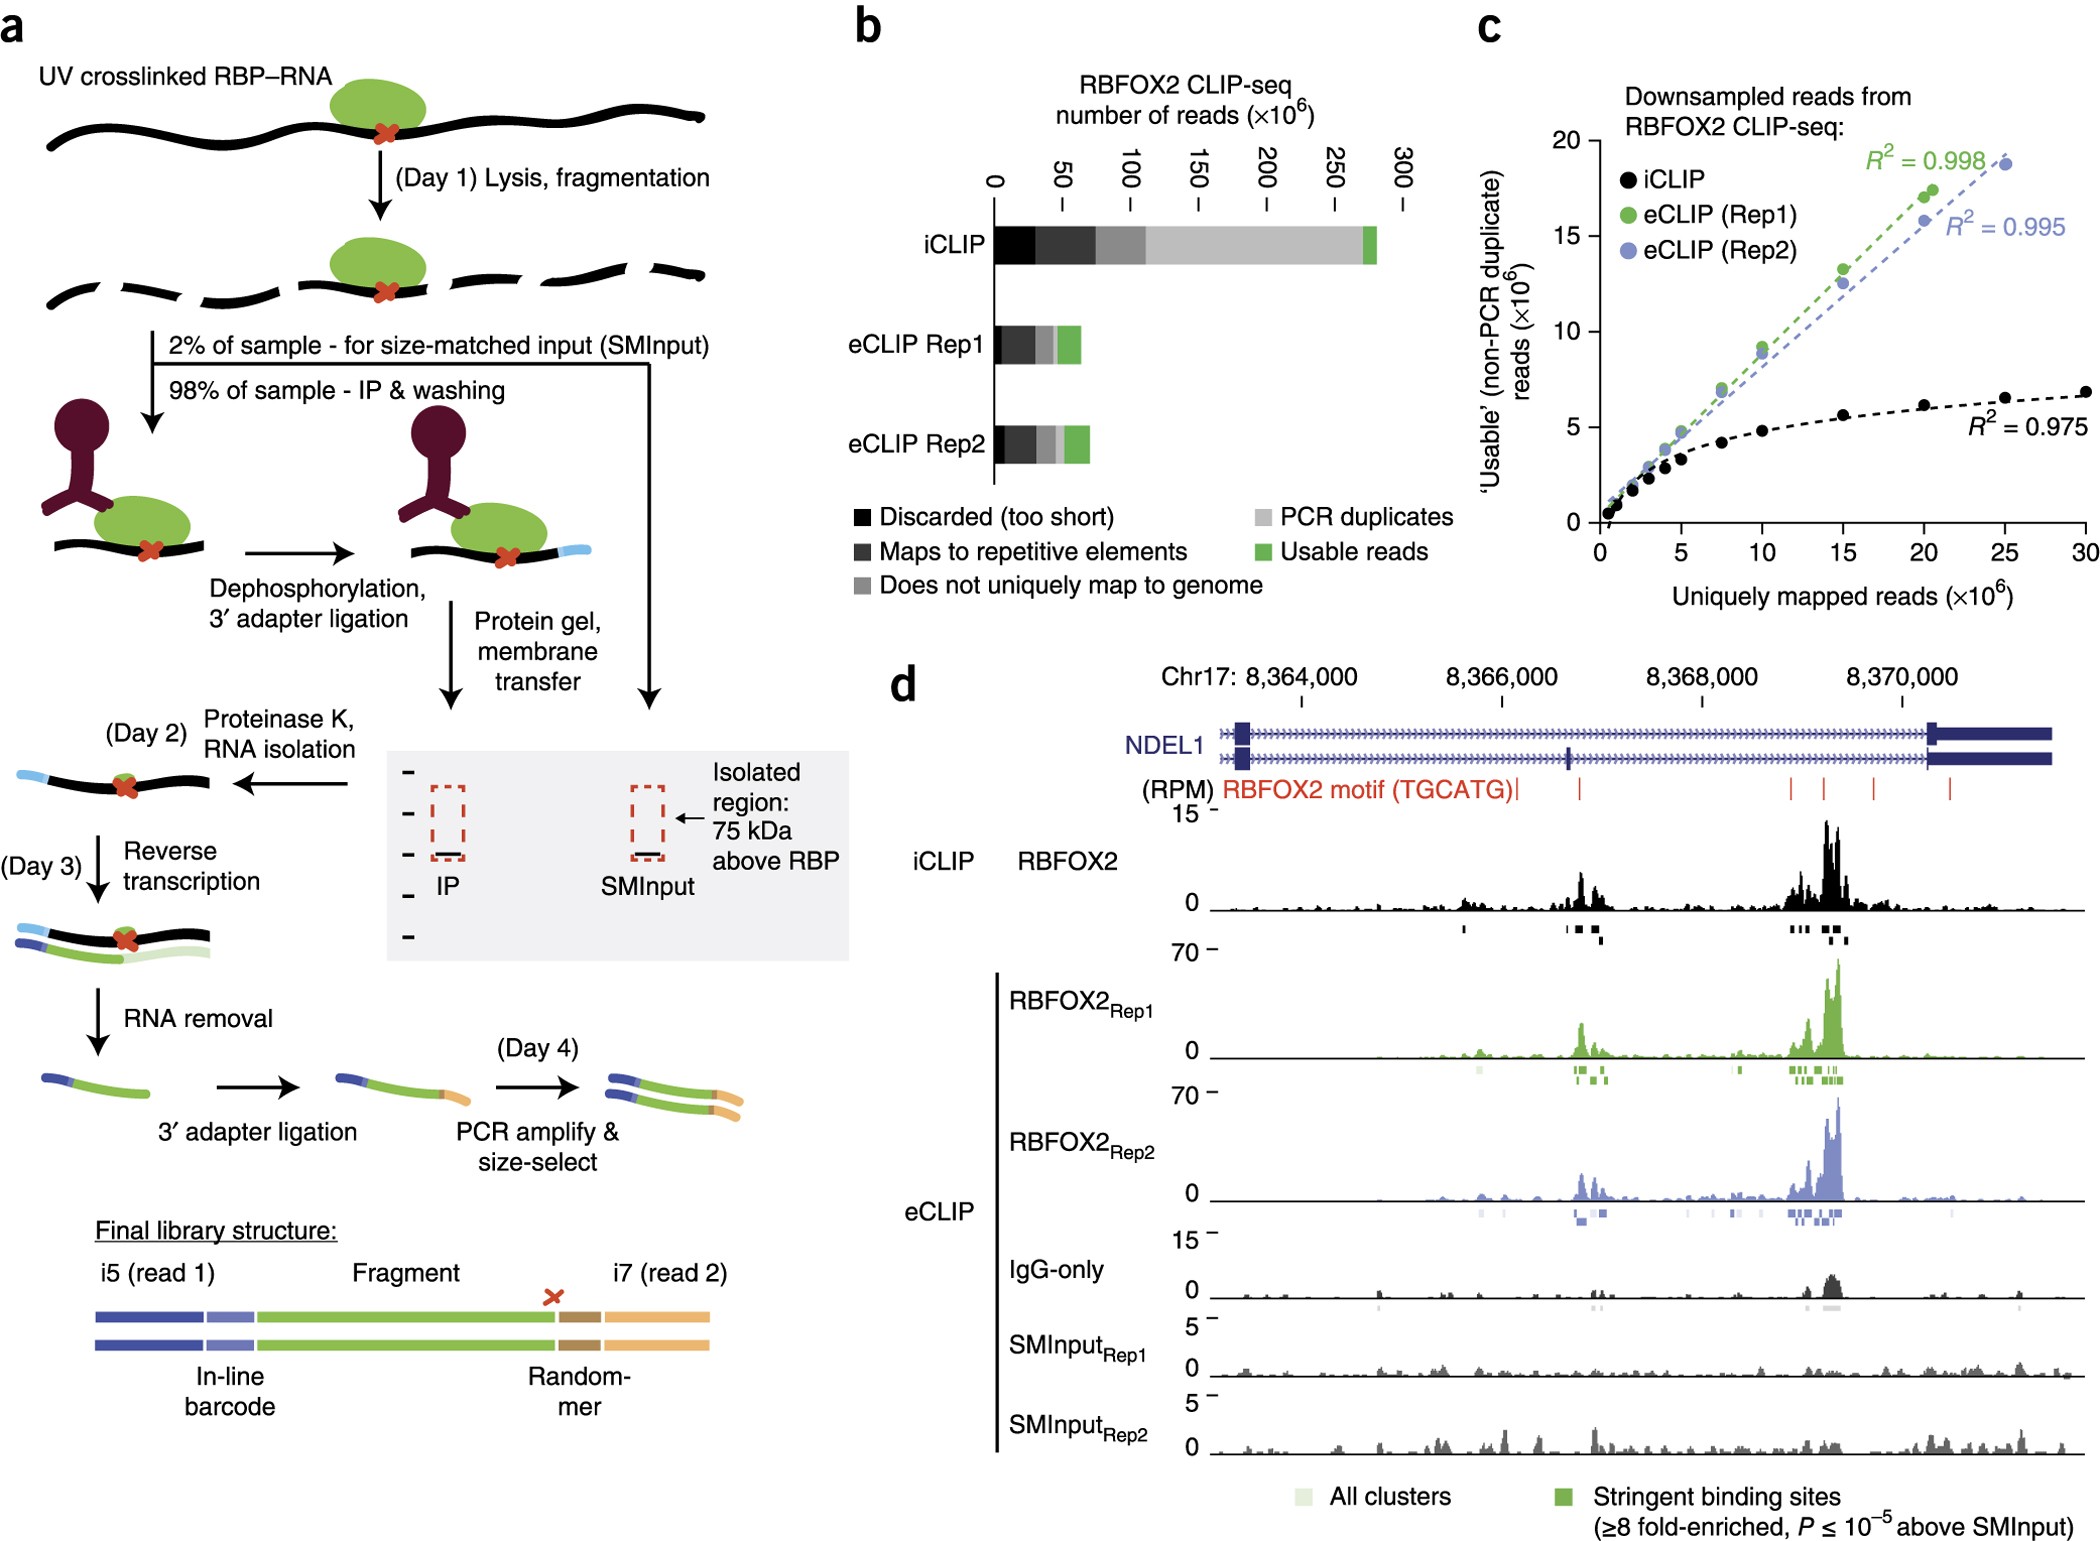
The design of a eCLIP experiment comes with an Input, which is RNA before we pulldown the protein. This Input helps us to estimate the background noise. And the other file is IP, which is after we pull down the protein by some antibody (Immuno Precipitation, if you like). Input gives us a good estimate of the null distribution where we can test IP upon.
So I wrote a script to do these steps:
- get total reads mapped in input and IP bam files.
- get reads mapped to each region.
- construct null distribution using poission, and calculate p-value for each region (using multiprocessing).
- multiple hypothesis correction.
And I sent it to the server with 6 eCLIP experiments (only 6!) using 5 processor (luxurious). After a weekend it still did not end.
(As a contrast, CLIPper can process ~250 experiments in 4-ish days. And some review papers are saying CLIPper is slow…That means my new peak caller is ultra-slow.)
What’s wrong?
Peeking into the steps.
Luckily, my script do output some message to standard output telling me which steps they are at. I took a look and found all of them are stucked at step 2.
Here’s how I do step 2:
def main(...):
...
    # region counts
    input_bam = BedTool(ip_bamfile)
    smi_bam = BedTool(input_bamfile)
    ip_region_count = feat.coverage(input_bam, s=True, counts=True).saveas()
    smi_region_count = feat.coverage(smi_bam, s=True, counts=True).saveas()
    print('finish region counting')

    # setup multiprocessing
    pool = Pool(int(n_pool))
    tasks = [
            (
            int(ip_region_count[i][-1])+1,
            int(smi_region_count[i][-1])+1,
            ip_total+1,
            smi_total+1,
            feat[i]
            )
             for i in range(len(feat))
             ] # pseudocount
    print('Total task:', len(tasks))
...
I use BedTool.coverage to count instead of pysam.AlignmentFile.count since it allows me to specify strand s=True. For looking to RNA binding protein, the strand of RNA is very important.
I look into what BedTool.coverage().saveas() is doing. It wraps around the command line BedTool and create a temporary file, storing its result. The next step “preparing multiprocessing input” has for i in range(len(feat) that might be reading the file line by line. I suspect this is I/O intensive and therefore … ultraslow!
Proving my suspision and replace it
Catching the culprit
I did a small experiment on the original approach. This estimates how much time it takes to do bedtool coverage and get number of reads per region.
import time

# load bam file
ipbam = BedTool(ip_bamfile)
feat = BedTool(lncRNA_transcript) # about 20000 lncRNA in gencode

# calulate how much time it needs to do `bedtool coverage`
start = time.perf_counter()
cov = feat.coverage(ipbam)
bedtool_end = time.perf_counter()
print('bedtool coverage takes {} sec'.format(bedtool_end - start))

# calculate how much time to get the number I need
nread = [int(float(cov[i][-1])) for i in range(len(feat))]
all_end = time.perf_counter()
print('get read {} sec'.format(all_end - bedtool_end))
Outputs:
bedtool coverage takes 19.560544402804226 sec
What about the second step?
It just never end!
GOTCHA.
Find an alternative.
bedtool coverage is slow, and reading the result from the tmp file is even slower! I need some alternatives. Apparently pysam.AlignmentFile.count is not an option, due to its lack of strandedness. So I look into the source code of CLIper and many posts in biostar. They all point to pysam.AlignmentFile.fetch and use read.is_reverse() to filter for strand. The solution is not as elegant as an one liner - BedTool.coverage(s=True) - but…. I have no option!
So I profiled the same task, replaceing bedtool with pysam.fetch
feat = BedTool(lncRNA_transcript)
import time
bam = pysam.AlignmentFile(ip_bamfile)
start = time.perf_counter()
for interval in feat:
    reads = bam.fetch(interval.chrom, interval.start, interval.stop)
    if interval.strand == '-':
        nreads = len([read for read in reads if read.is_reverse])
    else:
        nreads = len([read for read in reads if not read.is_reverse])

end = time.perf_counter()
print('pysam takes {} sec'.format(end-start))
Outputs:
pysam takes 8.107670875266194 sec
So pysam complete everything in 8 secs while bedtool coverage takes forever :).
Why pysam can do it fast?
I am not entirely sure. But I guess it is because bam files are indexed while bed files are just… beds. I would love to know why index can help with fast reading and how I can apply that to my future packages.
Speeding up more
After I replace bedtools with pysam, I still found this line slow:
tasks = [feature[i] for i in range(len(feature))]
it was coded as is because we need to read line 1 from 3 bed files.
So I did another small experiment to test the difference between using list indexand without index:
Use index
start = time.perf_counter()
l= [feat[i] for i in range(100)] ### DIFFERENCE
end = time.perf_counter()
print('use index {} sec'.format(end-start))
Outputs:
use index 0.12047397485002875 sec
Without index
start = time.perf_counter()
l= [i for i in feat[:100]] ### DIFFERENCE
end = time.perf_counter()
print('use {} sec'.format(end-start))
use 0.0029569659382104874 sec
Why?
Not sure… But this happens for lists in python
test_list = list(range(100000000))

# NO INDEX
start = time.perf_counter()
[i for i in test_list]
end = time.perf_counter()
print('no index takes {} secs'.format(end-start))

# USE INDEX
start = time.perf_counter()
[test_list[i] for i in range(5)]
end = time.perf_counter()
print('use index takes {} secs'.format(end-start))
Outputs:
no index takes 3.295161268673837 secs
use index takes 0.0001824619248509407 secs
Result
I tried it for 16826 lncRNAs.
from metadensity.region_call import *
import time

start = time.perf_counter()
bed = main(ip_bamfile, input_bamfile, lncRNA_transcript,n_pool = 2)
end = time.perf_counter()
print('lncRNA calling takes {} secs'.format(end-start))

bed.saveas('HNRNPK_lncRNA.bed')
Output:
Total reads in IP: 7218684; Input 5930950
done extract features
calling for 16826 regions:
no feature unadj p-val < 0.05 2504
after filter: (63, 9)
lncRNA calling takes 372.3315259660594 secs
takes about 6 mins.
Sending the original 6 jobs finishes within an hour.
Summary
This is not the first time I produce ultra-slow programs. Maybe I should learn more about code profiling and integrate them into my everyday developing routine?
Love to learn how you deal with those very software engineer problems. Comment below!