Sketching: Summarizing Large Genomic Dataset
The post is derived from Vineet Bafna’s lecture CSE283 UCSD and Ben Leagmead’s youtube lecture on Dashing. I like the video a lot. It provides very clear and intuitive explanation to what happened in sketching.
Given all the genomes in NCBI database, how can find the distance between all of them? Last time, we saw bloom filters can compress sequencing experiment into a shorter binary vector, helping us to filter out certain experiment of interest. Can similar ideas help us to compare between 2 or multiple experiments with good speed?
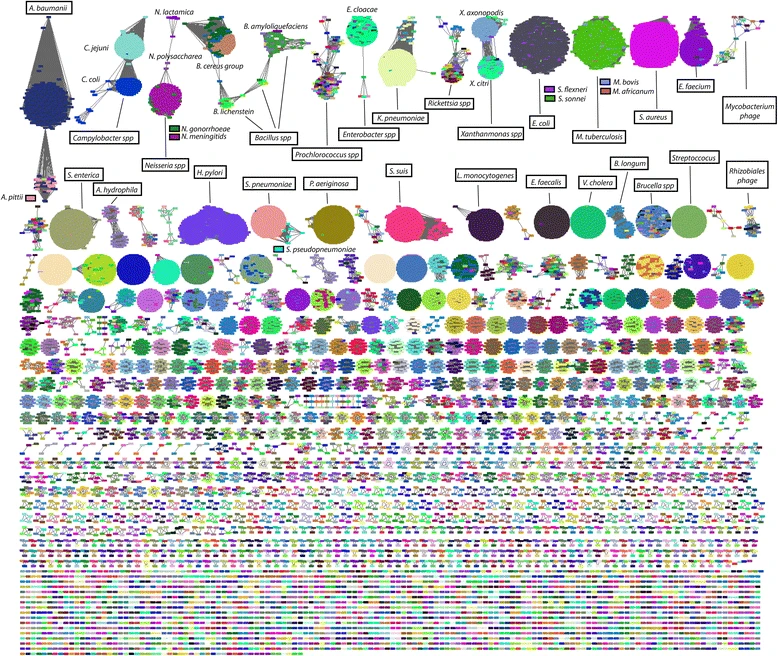 Image from Figure 3, Mash: fast genome and metagenome distance estimation using MinHash.
If we use the naive approach, it will probably take super super long to compare tens of thousands of genomes, given we need a lot of time to assemble and align.
What is sketching
Sketching is a very compact data structure to summarize large genomic dataset, and allow us to ask “similarity questions” between pairs of dataset.
“Similarity questions” can be “How many b.p. are two genomes different?”
How to sketch?
- Get some genomic data (FASTA, FASTQ)
- Make all reads into k-mer
- Hash every k-mer (each k-mer will become a number).
- Select some numbers from each dataset, and compare how many numbers they share to estimate the similarity.
Why is sketching powerful?
| They can estimate cardinality! $ | A | $, $ | B | $, $ | A \cup B | $, $ | A \cap B | $, when $A$ and $B$ are the k-mers in each genomes/metagenome. |
These can then be used to compute jaccard distance $J = \frac{A \cap B}{A \cup B}$.
Why might sketching work? An intuition of Hat problem.
Say we have a lottery box containing cards with number 0-1000 written on them. Ben will randomly draw some (but we don’t know how many) from the box and put into his hat. The task is to guess how many cards are there in Ben’s hat.
We can only ask for 1 card from the hat. We can ask him to give us the “median card”, or the “minimum card”.
If the “maximum card” is 999, how would we estimate the number of cards in the hat? If the “maximum” is 50, would we estimate it differently?
How does that relate to genomes?
We use hash function to transform k-mers to numbers. A good hash function will assign numbers uniformly, similar to the process - “randomly drawing cards to the hat”. By looking at the numbers from the hat, we can estimate the number of k-mers.
How to estimate cardinality: Bottom k sketch
But what we care is how similar are two genomes, A and B.
| What we want is the the intersection $ | A \cap B | $ from hat A and hat B, it seems getting only 1 representative is not enough to estimate. |
Comparing all cards might take too much time, given a human genome will likely generate ~ 3 billion k-mers (and thus 3 billion numbers/cards).
Let’s not compare all of them. We can sample “some” cards for comparison.
One sampling strategy is to take the minimal $k$ numbers from both hats/genomes, and see how many of them coincide with each other. This is called the bottom k sketch.
Alternatively, k-partition approach partition the number into three sets $0-333, 334-666, 666-1000$, and pick the minimum of each partition.
Mash: bottom-k MinHash sketching use similar approach.
HyperLogLog: reduce space used to store these numbers
Say our hash function is 32 bits. The number it generated range from $0 to 2^{32}$. It will takes $\log_2 {2^32} = 32$ bits to store each representative.
We want to save more space. So instead of storing the original number $1234$, we store the rounded version of $\log_2 (1234)$. The number of bits we need reduce to $\log_2 \log_2 {2^32}$. This is where HyperLoglog comes from.
Doing this can save space. But it can also lose some information.
From k-mer Jaccard index to Genomic Distance
Suppose we have genome $A$ and genome $B$.
Each of them is of length $n$.
The percent of mismatch between $A$ and $B$ is $d$.
When a k-mer appear in $A$, there is probability $(1-d)^k$ also appearing in $B$.
In total there are $n-k+1 ~ n$ k-mers. Therefore we can expect $n(1-d)^k$ shared k-mers.
From here we derive jaccard distance of k-mers: $J = \frac{A \cap B}{A \cup B} = \frac{n(1-d)^k}{2n - k(1-d)^k} = \frac{(1-d)^k}{2-(1-d)^k}$
Then we can establish the relationship between $d$, percent mismatch, with $J$.
So if we can calculate $J$ from sketching, we can get the approximate $d$.
Other bioinformatics examples
- MinHash Sketch: Assembling large genomes with single-molecule sequencing and locality-sensitive hashing. Within a lot of sequencing reads, find pairs of reads that share many k-mers (similarity) and glue them together (help assembly).
- Fast ANI Estimate similarity between prokaryotic genomes
Reference
- CSE283 Lecture Notes
- Ben Langmead’s lecture on Dashing
- Mash: fast genome and metagenome distance estimation using MinHash.
- Assembling large genomes with single-molecule sequencing and locality-sensitive hashing.
- High throughput ANI analysis of 90K prokaryotic genomes reveals clear species boundaries